Grade 9 Geography unit 4
How Ethiopia's population growth rate changed
1:25 · Explainer 1 of 2 on unit 4
A short animated Temari explainer on Grade 9 Geography unit 4: How Ethiopia's population growth rate changed. Every word it says is written out under the video.
Everything the explainer says
The explainer's words, part by part, as its captions show them.
Slow growth before 1920
Table 4.1 in your textbook tracks Ethiopia's yearly growth rate.
In 1900 it was just 0.2 percent, and it stayed under one percent until about 1920.
The mortality rate, the death rate, was high.
Disease control pushed it up
After that it climbed, to 2.0 percent by 1950.
From the 1950s, worldwide efforts to control malaria and other diseases pushed it up year after year.
It peaked at 3.1 percent in 1984.
Then a slight decline
Then look at the three censuses.
The rate was 3.1 percent in 1984, 2.9 in 1994, and 2.0 in 2007: a slight decline.
Yet the population kept growing, from 42.6 to 73.8 million.
Still one of the fastest
For 2010 to 2020, the UN puts it at about 2.6 percent, below the peak.
But Ethiopia, the second most populous country in Africa, still has one of the fastest growing populations in the world.
The growth rate
Slow before 1920, a peak in 1984, and a slight decline since.
Save this one for revision.
The full lesson on unit 4
Temari's longer video lesson on this chapter, with every word written out on its page.
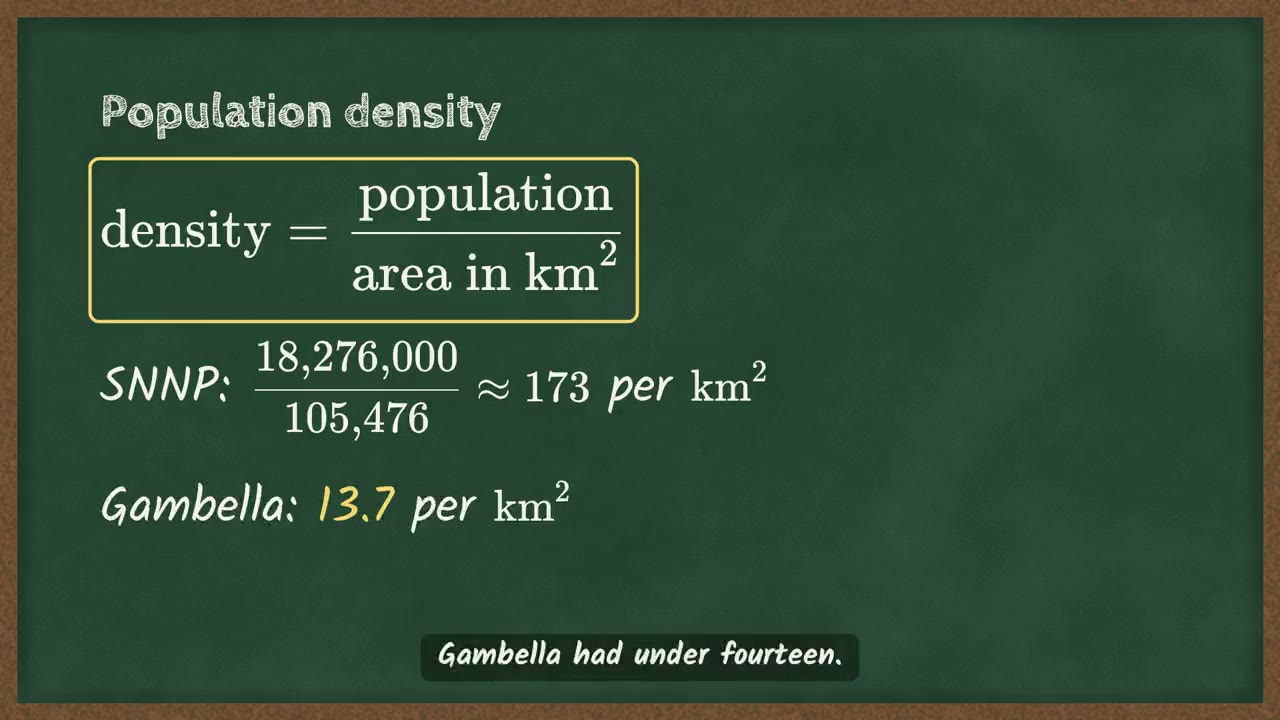 Where Ethiopians live: population density4 min
More explainers on unit 4
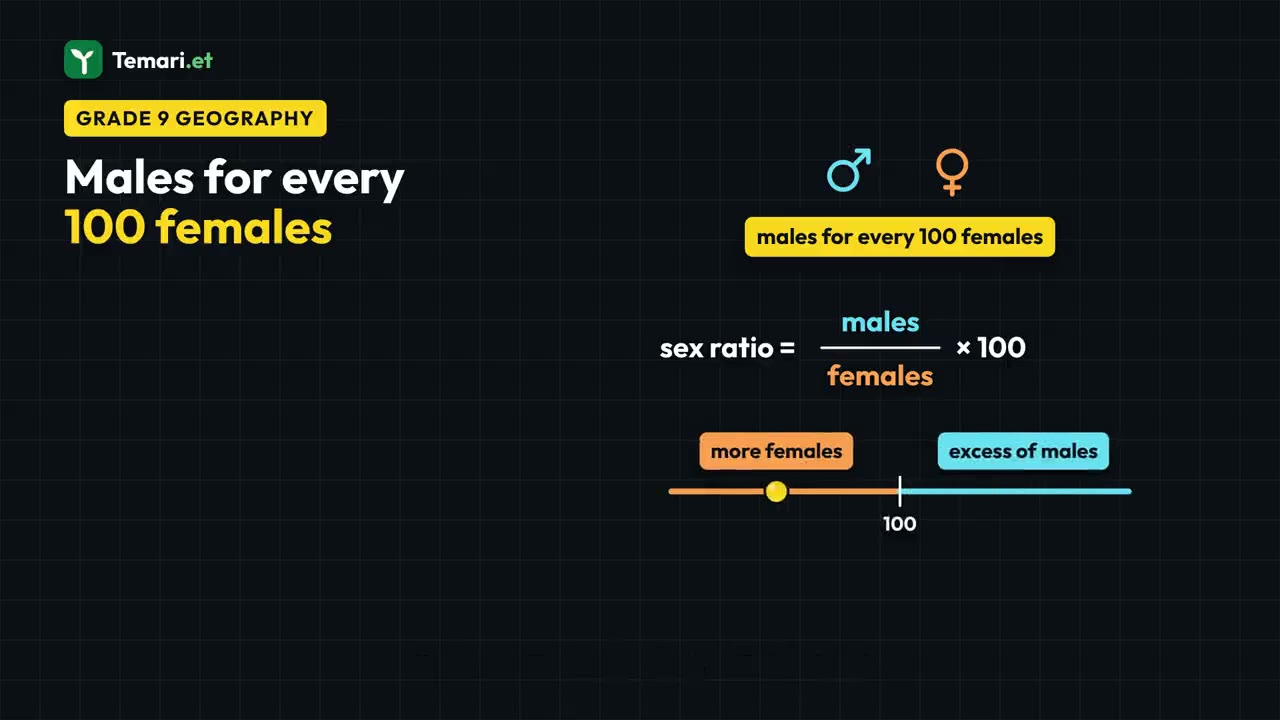
More on unit 4
The chapter's own page holds the rest of what Temari has on it, such as short notes and practice questions with their answers.
Open the unit 4 pagePractise this unit in the app
Temari turns this chapter into timed practice and marks it as you go, with an AI tutor to explain anything that did not land.
Start free
Temari.et is also an Android app, free on Google Play.