
Grade 12 results are out. Where to check yours

Unit notes and practice questions

Grade 12 Mathematics unit 3: Statistics

Everything here is for unit 3 of the Grade 12 Mathematics textbook: what the chapter covers, the short notes, practice questions with their answers, and the lesson video where one exists.

Get it on Google Play
7
Cards
10
Practice questions on unit 3
159–236
The textbook pages for unit 3

What unit 3 covers

  1. 1.Measures of Absolute Dispersions
  2. 2.Interpretation of Relative Dispersions
  3. 3.Use of Frequency Curves
  4. 4.Sampling Techniques

Short notes for unit 3

The cards filed under this chapter on the Grade 12 Mathematics page. Open one at a time.

Measure TypeUnit of MeasurementMain PurposeExamples
Absolute dispersionSame unit as the dataMeasures the spread of a single data setRange, Inter-quartile range, Mean deviation
Relative dispersionUnitless (dimensionless)Compares variability between two or more data setsCoefficient of range, Coefficient of variation

When you use it

Use this comparison to decide whether to report spread in original units or use a unitless ratio to compare different data sets.

Watch out

Never use absolute measures of dispersion to compare two data sets that have different measurement units.

Drafted from Grade 12 Mathematics, pages 159-236, then checked twice before it went up

MD=∑∣xi−A∣nMD = \frac{\sum |x_i - A|}{n}
MDMD
Mean deviationunitofdataunit of data
xix_i
Individual observation valueunitofdataunit of data
AA
Central average used: mean, median, or modeunitofdataunit of data
nn
Total number of observationsdimensionlessdimensionless

When you use it

Use this formula to find the average absolute distance of raw data points from the mean, median, or mode.

Watch out

Always take the absolute value of each difference before summing. Summing deviations without absolute values about the mean always yields zero.

Drafted from Grade 12 Mathematics, pages 159-236, then checked twice before it went up
Qk=L+(kn4−cff)wQ_k = L + \left(\frac{\frac{k n}{4} - cf}{f}\right) w
QkQ_k
k-th quartileunitofdataunit of data
LL
Lower class boundary of the quartile classunitofdataunit of data
kk
Quartile order, where k is 1, 2, or 3dimensionlessdimensionless
nn
Total number of observationsdimensionlessdimensionless
cfcf
Cumulative frequency of the class preceding the quartile classdimensionlessdimensionless
ff
Frequency of the quartile classdimensionlessdimensionless
ww
Class interval width of the quartile classunitofdataunit of data

When you use it

Use this formula to calculate the first quartile, median, or third quartile in a grouped frequency table.

Watch out

The term cf is the cumulative frequency of the class before the quartile class, not the quartile class itself.

Drafted from Grade 12 Mathematics, pages 159-236, then checked twice before it went up

R=BU(H)−BL(L)R = B_U(H) - B_L(L)
RR
Rangeunitofdataunit of data
BU(H)B_U(H)
Upper class boundary of the highest classunitofdataunit of data
BL(L)B_L(L)
Lower class boundary of the lowest classunitofdataunit of data

When you use it

Use this formula to calculate the range of a continuous grouped frequency distribution.

Watch out

Do not subtract raw class limits. Always find the true class boundaries first.

Drafted from Grade 12 Mathematics, pages 159-236, then checked twice before it went up

When you use it

Review this when finding range, class width, or quartile positions in grouped distributions.

Watch out

Discrete class limits leave gaps between classes. Calculate class boundaries by subtracting 0.5 from the lower limit and adding 0.5 to the upper limit for integer data before computing range or quartiles.

Drafted from Grade 12 Mathematics, pages 159-236, then checked twice before it went up

Median=L+hf(n2−C)\text{Median} = L + \frac{h}{f}\left(\frac{n}{2} - C\right)
LL
lower class BOUNDARY of the median class
hh
class width, upper boundary minus lower boundary
ff
frequency of the median class
nn
total frequency, the sum of every f
CC
cumulative frequency of the class BEFORE the median class

When you use it

Use when the data arrives as classes with frequencies and no individual values, so there is no middle number to read off. Build the cumulative frequency column, find the first class whose total reaches n over 2, and that is the median class the formula works inside.

Watch out

The width h comes from the BOUNDARIES, not the written limits. A class written 60 to 69 has boundaries 59.5 to 69.5, so h is 10 and not 9. Taking 9 shifts the answer by half a class, which is enough to move a grade, and it is the error most often copied off revision sheets.

Mode=L+h(fm−f1(fm−f1)+(fm−f2))\text{Mode} = L + h\left(\frac{f_{m} - f_{1}}{(f_{m} - f_{1}) + (f_{m} - f_{2})}\right)
LL
lower class BOUNDARY of the modal class
hh
class width, taken from the boundaries
fmf_{m}
frequency of the modal class, the largest one
f1f_{1}
frequency of the class just before it
f2f_{2}
frequency of the class just after it

When you use it

Use when you need the most common value and the data is in classes, so no single value repeats. The modal class is simply the one with the highest frequency, and the formula places the mode inside it by leaning towards whichever neighbour is smaller.

Watch out

Two classes tied for the highest frequency means the data has two modes and this formula does not apply to either. Check the neighbours before writing anything down. Classes must also be equal in width for the result to mean anything, which is worth checking when a table's last class is left open.

Practice questions on unit 3

10 multiple-choice questions written against this chapter, each with its answer and the reason. Try one before you open the answer.

Question 1

Find the range of the data set: 25, 21, 22, 20, 19, 16.

  1. A.6
  2. B.9
  3. C.16
  4. D.25
Show the answer and why

Answer: B 9

Why

The range is the largest value minus the smallest value. The largest value is 25 and the smallest is 16. So R = 25 - 16 = 9.

Question 2

A supermarket in Addis Ababa recorded its daily sales (in Birr 100) for twelve days: 115, 134, 120, 111, 122, 103, 80, 155, 122, 104, 110, 98. What is the range of these sales?

  1. A.57
  2. B.75
  3. C.80
  4. D.155
Show the answer and why

Answer: B 75

Why

The largest value is 155 and the smallest value is 80. So R = 155 - 80 = 75 (in Birr 100).

Question 3

Find the mean of the data set: 50, 80, 80, 110, 110, 110, 140, 160.

  1. A.80
  2. B.105
  3. C.110
  4. D.840
Show the answer and why

Answer: B 105

Why

Add all the values to get 840. There are 8 values. So the mean is 840 / 8 = 105.

Question 4

Two basketball teams scored points in ten games. Team B scored: 53, 46, 48, 50, 53, 53, 58, 60, 57, 52. What is the range of Team B's scores?

  1. A.7
  2. B.14
  3. C.46
  4. D.60
Show the answer and why

Answer: B 14

Why

The largest score is 60 and the smallest score is 46. So the range is 60 - 46 = 14.

Question 5

Find the mean deviation about the mean of the data set: 50, 80, 80, 110, 110, 110, 140, 160.

  1. A.21
  2. B.25
  3. C.26.25
  4. D.210
Show the answer and why

Answer: C 26.25

Why

First, the mean is 105. Take the absolute deviation of each value from 105: 55, 25, 25, 5, 5, 5, 35, 55. Their sum is 210. Divide the sum by the number of values: 210 / 8 = 26.25.

Question 6

Find the variance of the data set: 16, 12, 8, 18, 5, 9, 24, 20.

  1. A.6.14
  2. B.14
  3. C.37.75
  4. D.302
Show the answer and why

Answer: C 37.75

Why

The mean is (16 + 12 + 8 + 18 + 5 + 9 + 24 + 20) / 8 = 112 / 8 = 14. The squared deviations are 4, 4, 36, 16, 81, 25, 100 and 36. Their sum is 302. The variance is 302 / 8 = 37.75. The value 6.14 is the standard deviation, not the variance.

Question 7

The daily scores of a group of students are: 96, 70, 100, 89, 78, 56, 45, 78, 68, 42, 66, 89, 90, 54, 44, 67, 87, 97, 98. Find the quartile deviation (QD).

  1. A.17
  2. B.34
  3. C.56
  4. D.90
Show the answer and why

Answer: A 17

Why

First arrange the 19 scores in order. The first quartile is the 5th item, which is 56. The third quartile is the 15th item, which is 90. The quartile deviation is half the difference: QD = (90 - 56) / 2 = 17.

Question 8

Set A is: 20, 70, 70, 70, 70, 70, 70, 70, 100. What is the inter-quartile range (IQR) of Set A?

  1. A.0
  2. B.20
  3. C.70
  4. D.80
Show the answer and why

Answer: A 0

Why

The first quartile Q1 is 70 and the third quartile Q3 is 70. So IQR = Q3 - Q1 = 70 - 70 = 0. Note that the range of Set A is 80, but the IQR ignores the extreme values 20 and 100.

Question 9

Find the mean deviation about the median of the data set: 12, 9, 15, 12, 7, 10, 12.

  1. A.1.43
  2. B.1.57
  3. C.1.86
  4. D.2.00
Show the answer and why

Answer: C 1.86

Why

Arrange the data: 7, 9, 10, 12, 12, 12, 15. There are 7 values, so the median is the 4th value, which is 12. The absolute deviations from 12 are 5, 3, 2, 0, 0, 0, 3. Their sum is 13. So the mean deviation about the median is 13 / 7, which is about 1.86.

Question 10

Find the coefficient of range for this data set: 22, 28, 31, 23, 24. Use the formula CR = (L - S) / (L + S), where L is the largest value and S is the smallest value.

  1. A.0.17
  2. B.0.29
  3. C.0.41
  4. D.0.50
Show the answer and why

Answer: A 0.17

Why

The largest value L is 31 and the smallest value S is 22. So CR = (31 - 22) / (31 + 22) = 9 / 53, which is about 0.17. The coefficient of range has no units.

The app holds 12 questions on this unit, marked as you go. These are the first 10.

The textbook pages for unit 3

Unit 3 runs from page 159 to page 236 of the Ministry of Education edition.

Ministry of Education edition, English, 426 pages

Download the PDF

Practise this unit in the app

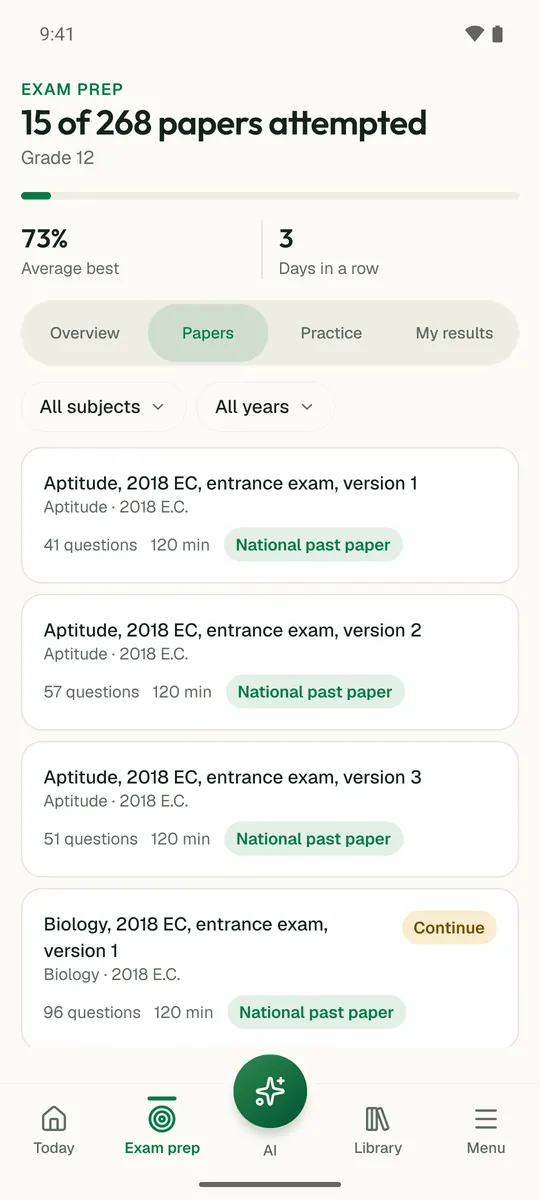
Temari turns this chapter into timed practice and marks it as you go, with an AI tutor to explain anything that did not land.

Start free

Temari.et is also an Android app, free on Google Play.

Sign inCreate your account