Grade 12 Mathematics unit 3
Measuring spread with the middle half of the data
1:27 · Explainer 1 of 2 on unit 3
A short animated Temari explainer on Grade 12 Mathematics unit 3: Measuring spread with the middle half of the data. Free to watch, no account needed.
Everything the explainer says
The explainer's words, part by part, as its captions show them.
Which set is more spread out?
Your textbook compares two data sets, drawn here as dots on a number line.
In set A, seven of the nine values are 70. Set B is spread from 20 to 100.
Which set is more spread out?
The range sees only the ends
The range is the largest value minus the smallest.
For both sets, that is 100 minus 20, which is 80.
The same range, yet B is far more spread out. The range only sees the two ends.
Measure the middle half
So measure the middle half instead.
The first quartile, Q₁, cuts off the lowest quarter of the data. The third quartile, Q₃, cuts off the top quarter.
In A, both quartiles land on 70. In B, they land on 30 and 90.
The interquartile range is Q₃ − Q₁: zero for A, and 60 for B.
One extreme value stretches the range
Now move the largest value of B from 100 out to 200.
The range jumps to 180.
But the middle half has not moved, so the interquartile range is still 60.
Range and interquartile range
The range uses only the two extreme values. The interquartile range measures the middle half of the data.
Save this one for your exam.
The full lesson on unit 3
Temari's longer video lesson on this chapter, with every word written out on its page.
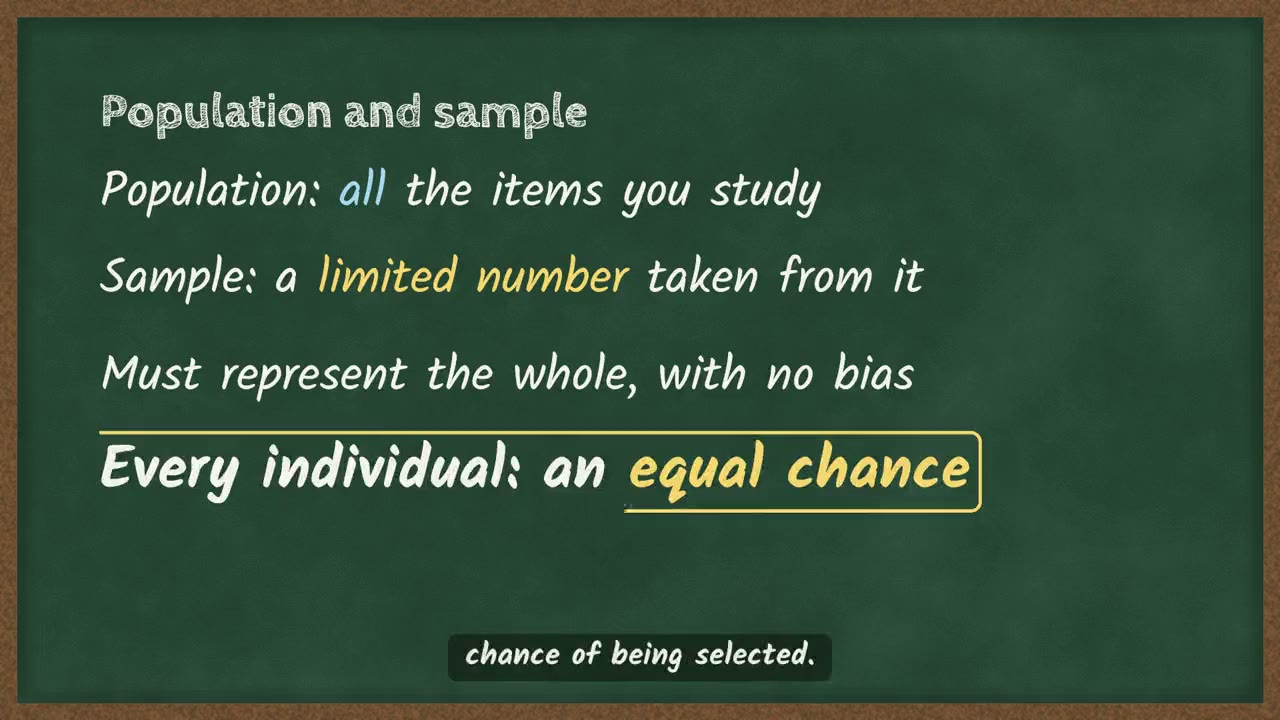 Four ways to choose a random sample4 min
More explainers on unit 3
More on unit 3
The chapter's own page holds the rest of what Temari has on it, such as short notes and practice questions with their answers.
Open the unit 3 pagePractise this unit in the app
Temari turns this chapter into timed practice and marks it as you go, with an AI tutor to explain anything that did not land.
Start free
Temari.et is also an Android app, free on Google Play.