
On this page
The five years, as the service plots them
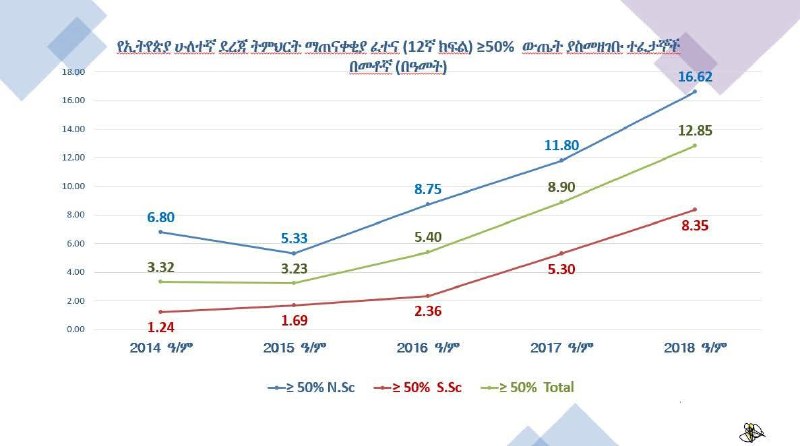
| Year (E.C.) | Natural science | Social science | All candidates |
|---|---|---|---|
| 2014 | 6.80% | 1.24% | 3.32% |
| 2015 | 5.33% | 1.69% | 3.23% |
| 2016 | 8.75% | 2.36% | 5.40% |
| 2017 | 11.80% | 5.30% | 8.90% |
| 2018 | 16.62% | 8.35% | 12.85% |
Read down the last column and the shape is clear enough. The figure falls slightly in 2015, holds, then adds about two points in 2016, three and a half in 2017 and four in 2018. Three consecutive years of real movement is the actual finding, and it is a larger claim than any single year's number.
The two streams have not moved together
Social science is the stream that grew fastest. It went from 1.24 percent to 8.35 percent, which is close to seven times where it started, while natural science went from 6.80 to 16.62, a little under two and a half times. That sounds like the gap closing, and in proportional terms it is.
Counted in percentage points, though, the gap is the widest it has been in the whole series. Natural science finished 5.56 points ahead of social science in 2014 and 8.27 points ahead in 2018. A social science candidate is still about half as likely to reach the mark as a natural science one.
3.9x
the share reaching 50 percent, 2014 to 2018
3.32% to 12.85%
6.7x
the rise in social science
1.24% to 8.35%
8.27
points between the streams in 2018
The widest in the series; it was 5.56 in 2014
One thing to hold in mind about 2017
The chart is headed "50 percent and above" and plots 8.90 percent for 2017 E.C. That is the figure the service uses for that year in its own announcement too, so the chart is consistent with itself. It is worth knowing where the number came from: 8.4 percent of candidates reached the 50 mark that year, and the rate became 8.9 percent after the Ministry lowered the cutoff to 49.5 percent once results were out. So one point in this series rests on a different cutoff from the others, and the chart does not say so.
The announcement these numbers come from, with the totals who registered and sat, is in 70,544 students passed the 2018 E.C. Grade 12 national exam. The region-by-region breakdown, the schools that passed everyone and the schools that passed nobody are in Where the Grade 12 passes came from.
Sources
Every figure and date above comes from one of these. Open them; a story about your child's school is worth checking.
- 150% ውጤት ያስመዘገቡ ተፈታኞች ቁጥር በየዓመቱ መሻሻል እያሳየ ነው (the five-year chart)Tikvah Education, 7 September 2026 (ጳጉሜ 2 ቀን 2018 ዓ.ም.)
- 2የ12ኛ ክፍል ሀገር አቀፍ መልቀቂያ ፈተና ከወሰዱ ተማሪዎች መካከል 12.8 በመቶ ወይም 70,544 ተማሪዎች የማለፊያ ውጤት ማምጣታቸው ተገለጸEducational Assessment and Examinations Service, 24 August 2026
- 3የ12ኛ ክፍል መልቀቂያ ፈተና የማለፊያ ነጥብ ያመጡ ተማሪዎች ቁጥር መሻሻል አሳይቷልEducational Assessment and Examinations Service, 22 August 2026